

Got an LG Watch Urbane? Congratulations – you’re part of a pretty exclusive club. Photo by Janitors on Flickr.
Back in February I tried to estimate how many Android Wear devices were activated in 2014, following Canalys saying that 720,000 had shipped that year.
The figure I got, based on the page on Google Play, where one can track not just downloads but also comments and average rating for the Android Wear app (which you need to control your shiny new Android Wear device), was 700,000.

Put it together, and we have about 560,000 Android Wear activations by the end of 2014, and 700,000 to mid-February.
Progress, or the lack of it
OK. So what about progress since then? I’ve kept noting the progress of the number of downloads, and the number of comments, on the Google Play page, helped from time to time by the Internet Archive (it’s wonderful. Donate).
My previous estimate worked on the basis that the number of comments was proportional to the number of downloads. I don’t see any reason to change that assumption.
So how does it look now? The number of comments keeps going up:
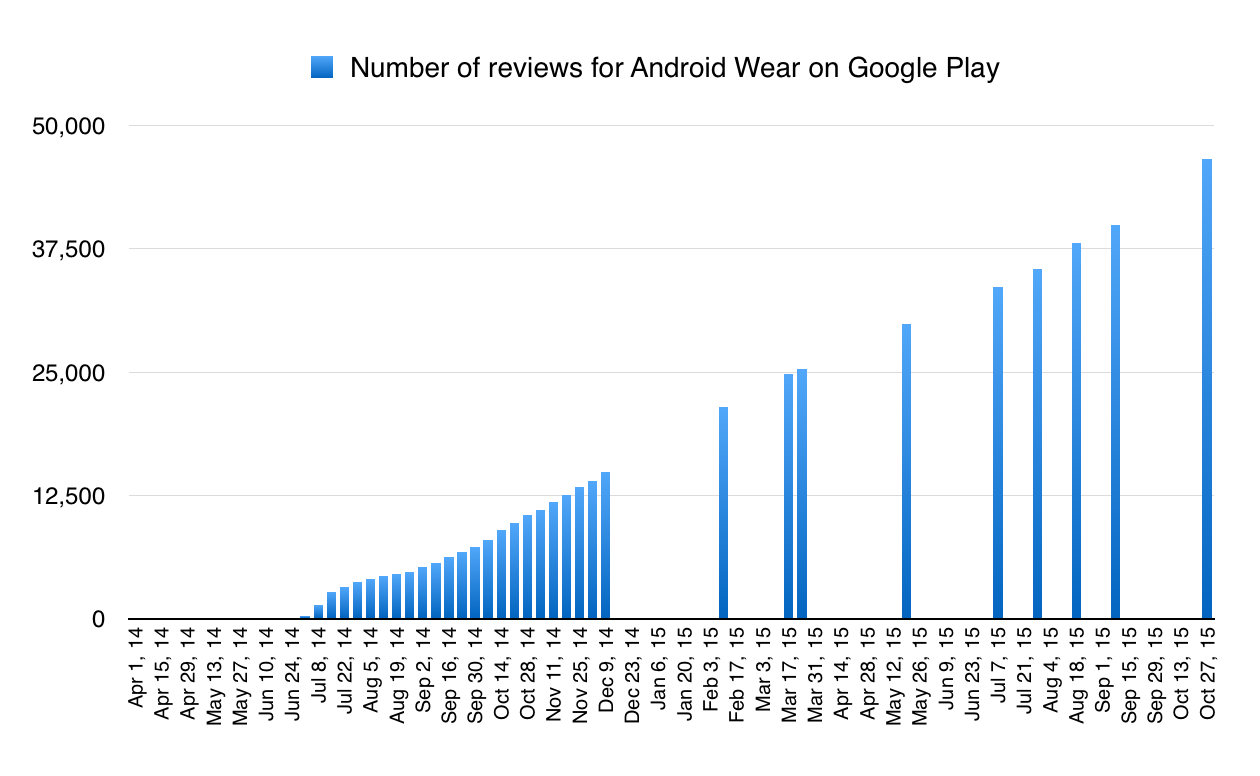
Steady growth suggests steady download, and hence sales, figures
(One point to note: the average review score has been trending down steadily. You would expect this for a new technology: the keen people who forgive anything are first in, and are followed by those who got it as a gift, or an experiment, or whatever. Notably, some of the recent low ratings come from people complaining about updates; that would suggest that the installs/comments ratio is actually falling.)
Whichever, the precise value of the average review has fallen from a comfortable 4.83 (out of 5) to dip to 3.98 at the end of October, recovering to 4.00 last week.
And now we try to fit the number of installs – using the points that we have, which isn’t a lot – to that graph, assuming downloads are directly proportional to comments.
According to Google’s stats, Android Wear is now past the 1m download point, but not the 5m download point.
So I’ve tried to fit the graph as best I can. And this is what I get:

Fitting known waypoints to the number of comments suggests that 1.9m Android Wear devices have been sold
That’s the figure I get: 1.9m downloads in total, suggesting that since February there have been a total of 1.2m more installations of Android Wear.
So again we ask: is that bad or good? There are now 1.4bn Android devices in use, according to Sundar Pichai. Only those running Android 4.3 upwards can use Android Wear, which means we’re potentially talking about 67.8% of devices according to the very latest figures from the Android Dashboard. (That’s up substantially from 47.6% back in February.)
The penetrant question
Back in February, I guessed at 1.2bn Android devices in use (which seems close enough – 1bn announced at Google I/O in 2014, 1.4bn this time). So back then the potential market was
1.2bn * 0.476 = 571.2m devices, of which 700,000 had Android Wear: that was a penetration of 0.12%.
Now we have a potential addressable market for Android Wear of
1.4bn * 0.678 = 949.2m devices. Of which it seems 1.9m, or 0.2%, have bought. (This doesn’t allow for people owning multiple devices, but the incidence will be very low compared to the 949m devices available.)
Conclusions and thoughts
• The absolute number of Android Wear devices in use is still really low.
• A total of 1.2m have been sold since February
• It’s tiny compared to any estimate of the number of Apple Watches sold since the launch in April, which varies by analyst; Canalys estimates that it has shipped 7m in two quarters, which compares to 1.2m Android Wear sold
• These may be the lull before the storm of purchases on Black Friday/Christmas, but abandonment could be a problem
• Android Wear, despite being first to market, suffers from a lack of brand visibility, and visibility overall. Kantar ComTech released a survey in October based on a study from August which found that in the US,
Among panelists who knew what a smartwatch or smartband was, 92% connected Apple to the category, far more than any other brand. This was followed by Fitbit in second place with 47%, with Google (34%) edging out Samsung (33%) for third place.
That doesn’t leave a lot of room for others, at least in the US buyer’s mind.
I’ll keep tabs on Android Wear, absent Google releasing any figures. But for now, this is starting to look like an interesting question: can a device category succeed if it doesn’t have a successful Android version?

The telling stat is that Android is 90% bigger than Apple but IOS App store revenue is 90% larger than android store revenue. Android is a fine free OS when included with a cheap phone but outside of employees who work for an android manufacturer, hardly anyone’s first choice – like the fact that Macs have 97% market share of $1k+ PC’s … if you have $1,000 to spend on a computer, 997 of 1,000 peopel choose Mac OS over WIN. Same with android OS, the WIN of smartphones – that’s why MS cannot gain any traction – there are only two OSes in the marketshare, the one you pay money for and the other free one. The analogy extends further with malware. Android is the new Windows.
I think that iOS App Store revenue is 2x that of Google Play, as measured in 2014 – based on the differential in installed base, it’s roughly 4:1 in favour of iOS in terms of spending (Benedict Evans has enumerated this).
Spending in app stores isn’t necessarily a key metric; installed base, churn and spending taken together give a clearer picture of the health of each respective ecosystem. However, the middle one is hard to get.
Not really. The one that makes the most money is the healthy one. That would be Apple with 70 percent more revenue than Google Play, while Google Play has 70 percent more app downloads. The first number is healthy, the second number is irrelevant.
It’s like the farmer who says he loses a penny for every chicken he ships to market. His friend says, “How can you keep losing money?” The farmer’s reply, “I make it up in volume.” Uh, no, you don’t.
Don’t judge the health of the ecosystem solely on how much the largest part of it makes. If app devs make less money there than elsewhere, they will move on regardless of how much profit Apple (or whoever) makes.
Remember how much of a “flop” the iPhone 5C that sold *only* 25M units was, despite the fact that ANY Android OEM would have sold their proverbial kidneys for that level of “flop” when the 5C would have easily grossed an average of 5x the profit over the average Android handset per unit sold?
The mainstream tech media are hopelessly unrealistic when in comes to Apple.
Pingback: Android Wear downloads: a more nuanced (and slightly higher) estimate | The Overspill: when there's more that I want to say